Why dentists are moving to interactive odontograms
There is a moment every dentist remembers. You are mid-appointment, patient in the chair, and you reach for the paper chart. It is there, technically. But the previous entry is smudged, there is a sticky note from three visits ago half-peeling off the corner, and somewhere under the crossed-out markings is the information you actually need. You find it. Eventually. The patient watches you search.
Nobody switches to digital charting because they read a whitepaper about it. They switch because of moments like that one. Because of the morning they spent 40 minutes reconstructing a patient's treatment history from a paper file that had been updated by four different hands over six years. Because of the claim that got rejected because a condition code on the chart did not match what was billed.
The odontogram dental is the map of every patient's mouth. When that map is interactive, connected, and alive, everything downstream gets better. This is why dentists are making the switch, and what the best interactive odontograms actually look like in practice.
Let's be honest about something: paper charts are not bad because they are old-fashioned. They are bad because they are fragile in exactly the ways that matter most in a clinical setting.
They are inconsistent; every dentist draws slightly differently, uses different abbreviations, and interprets symbols with slight personal variations. A chart completed by Dr. A means something subtly different than the same chart filled in by Dr. B, even in the same practice.
They are static; the moment you draw on a paper chart, it is a snapshot. Time passes, conditions change, and the chart becomes an archaeological record rather than a clinical tool. Cross things out, add notes in the margins, and eventually the original document is barely legible.
They are isolated; a paper odontogram lives in a folder, in a cabinet, in a room. It cannot trigger a treatment plan, feed into a billing code, or tell you that this patient was overdue for a recall six months ago.
And they are slow, not dramatically slow, but cumulatively slow. Those extra minutes per patient, across a full schedule and a full year, add up to a meaningful chunk of clinical time spent drawing rather than treating.
The irony is that paper charts feel faster. Until you try the alternative and realize how much time you were spending on workarounds you had stopped noticing.
What Actually Changes When You Go Interactive
The chart becomes a conversation, not a form
Here is something that happens in practices that use interactive odontograms: patients start engaging with their own oral health.
When a dentist turns a screen toward a patient and walks through an interactive chart, this is tooth 26; this is where we are seeing early caries; this is what we are proposing; something changes in the room. The patient is no longer receiving information; they are participating in it. They can see the problem. They understand the treatment. They leave with a PDF that shows exactly what was found and what was planned.
Treatment acceptance goes up. Not because of some sales technique, but because the patient finally understands what they are agreeing to.
Documentation stops being a burden
Multi-tooth selection. Touch gestures. Keyboard shortcuts. Automatic caries risk indices calculated in real time from recorded conditions. A hygienist who once spent 20 minutes on a paper period chart can complete the same documentation in a fraction of the time, and the result is more complete and more consistent than anything drawn by hand.
Chair-side tablets have made this even faster. You document as you treat, not after. The chart is current when the patient leaves the chair, not when you finally get around to writing it up at the end of the day.
The history actually exists
Digital odontograms do not overwrite. Every condition marked, every treatment recorded, every change made — it is timestamped and saved. The previous version is still there. The version before that is still there.
When a patient comes back after three years away, you do not excavate a folder. You scroll. You see exactly what their mouth looked like at every previous visit, what was treated, what was monitored, and what was discussed. That clinical continuity is worth more than any individual feature on a spec sheet.
Everything connects
This is the shift that practitioners feel most concretely after a few weeks. Mark a treatment on the odontogram, and it is already in the treatment plan. It flows to the billing code. It connects to the patient's appointment history, their imaging files, their communication record.
You stop re-entering data. You stop reconciling discrepancies between what the chart says and what was billed. The clinical record and the administrative record are the same record.
What to Look for - and What to Ignore
If you are evaluating interactive odontogram software, here is the honest version of what matters:
Buccal and oral views are easy to toggle. Sounds basic. Some platforms make switching between views surprisingly painful. Try it before you commit.
Primary and permanent dentition clearly distinguished. Blue for temporary and black for permanent is standard. Essential for pediatric patients and mixed dentition, should be automatic, not manual.
Soft tissue documentation. A good odontogram is not just about teeth. Palate, lips, tongue, and lymph nodes: if the system does not include these, you are still maintaining a separate paper record for part of every exam.
Automatic indices. Caries risk should be calculated from what you record, not computed separately. This saves time in busy practices.
Versioned history, nothing overwritten. Non-negotiable. If the system overwrites records rather than versioning them, you lose the clinical timeline.
Full integration with the rest of your PMS. An odontogram that does not connect to scheduling, billing, and treatment planning is just a digital drawing tool. Useful, but not transformative.
What to ignore: the number of colors available, how many icon styles there are, whether it looks impressive in a demo. The best odontogram is the one your team actually uses consistently.
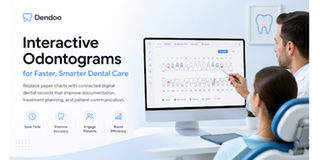
How Dendoo Does It
Dendoo's odontogram dental module was built around a simple question: what does the dentist actually need to do in the five minutes they have at the chair, and how do we make it as fast and accurate as possible?
The result covers the full scope of clinical charting, without making it feel like you are filling out a government form.
Each tooth is individually interactive. Click a tooth and select a condition from the standardized menu, composite, crown, implant, caries, erosion, plaque, or bleeding, on specific surfaces. Buccal and oral views at a toggle. No ambiguity, no interpretation required by whoever reads the chart next.
Multi-selection for faster charting. Select multiple teeth simultaneously. Touch and keyboard shortcuts throughout. In a practice that sees 20 patients a day, this adds up.
Automatic KP index. Caries risk is calculated in real time from what you record. You see the clinical signal as you chart, not after you have finished and done the math manually.
Primary and permanent teeth, clearly coded. Blue numbering is for temporary, and black for permanent. Instant visual clarity in pediatric and mixed dentition cases.
Soft tissue module included. Palate, lips, tongue, and lymph nodes are documented in the same interface and saved in the same patient file. Nothing falls through the gap.
Orthodontic view built in. Overbite, crowding, occlusal class, and other parameters are documented in a dedicated orthodontic odontogram, on the same platform, in the same patient file.
Complete chronological history. Every update is timestamped; nothing is overwritten. Scroll back through any patient's oral health timeline from the first visit.
PDF export with clinic branding. One click to a patient-ready report, formatted with your clinic's layout. Print it, email it, or attach it to a referral.
And because Dendoo is a full practice management platform, none of this is isolated. The odontogram is one tab in the patient file, directly connected to treatment planning, billing, scheduling, and imaging. Mark a treatment on the chart, and it is already in the plan. Already in the invoice. No duplication.
Dendoo includes the full odontogram module in its free plan. One month, unlimited patients, no feature restrictions. See what connected clinical documentation actually feels like at dental odontograms.
The Honest Summary
Interactive odontograms are not going to change how you do dentistry. The clinical decisions are still yours. The relationship with the patient is still yours.
What they change is the quality of the information you have when you make those decisions. The clarity of the record you leave for whoever treats this patient next. The confidence a patient feels when they can actually see their own oral health instead of nodding politely at a description.
Paper charts work. They just work the way fax machines work - reliably, predictably, and increasingly out of step with everything around them.
The dentists who have made the switch rarely go back. Not because of the technology. Because of the Monday morning when they realized they had not searched a folder in months.
Curious what it looks like in practice?
Explore the odontogram dental module inside Dendoo - free for a full month, fully integrated with scheduling, billing, and patient records.